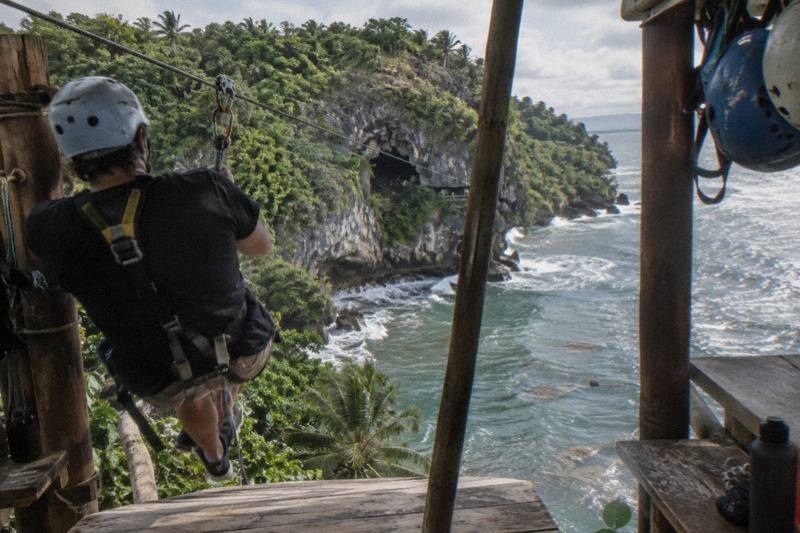
What Is The Injury Rate For Ziplines? Figures To Know Before A Fiji Tour
US emergency-department figures on zipline injuries, what injuries are most common, and what the standards and Fiji operators say, before you book a tour.
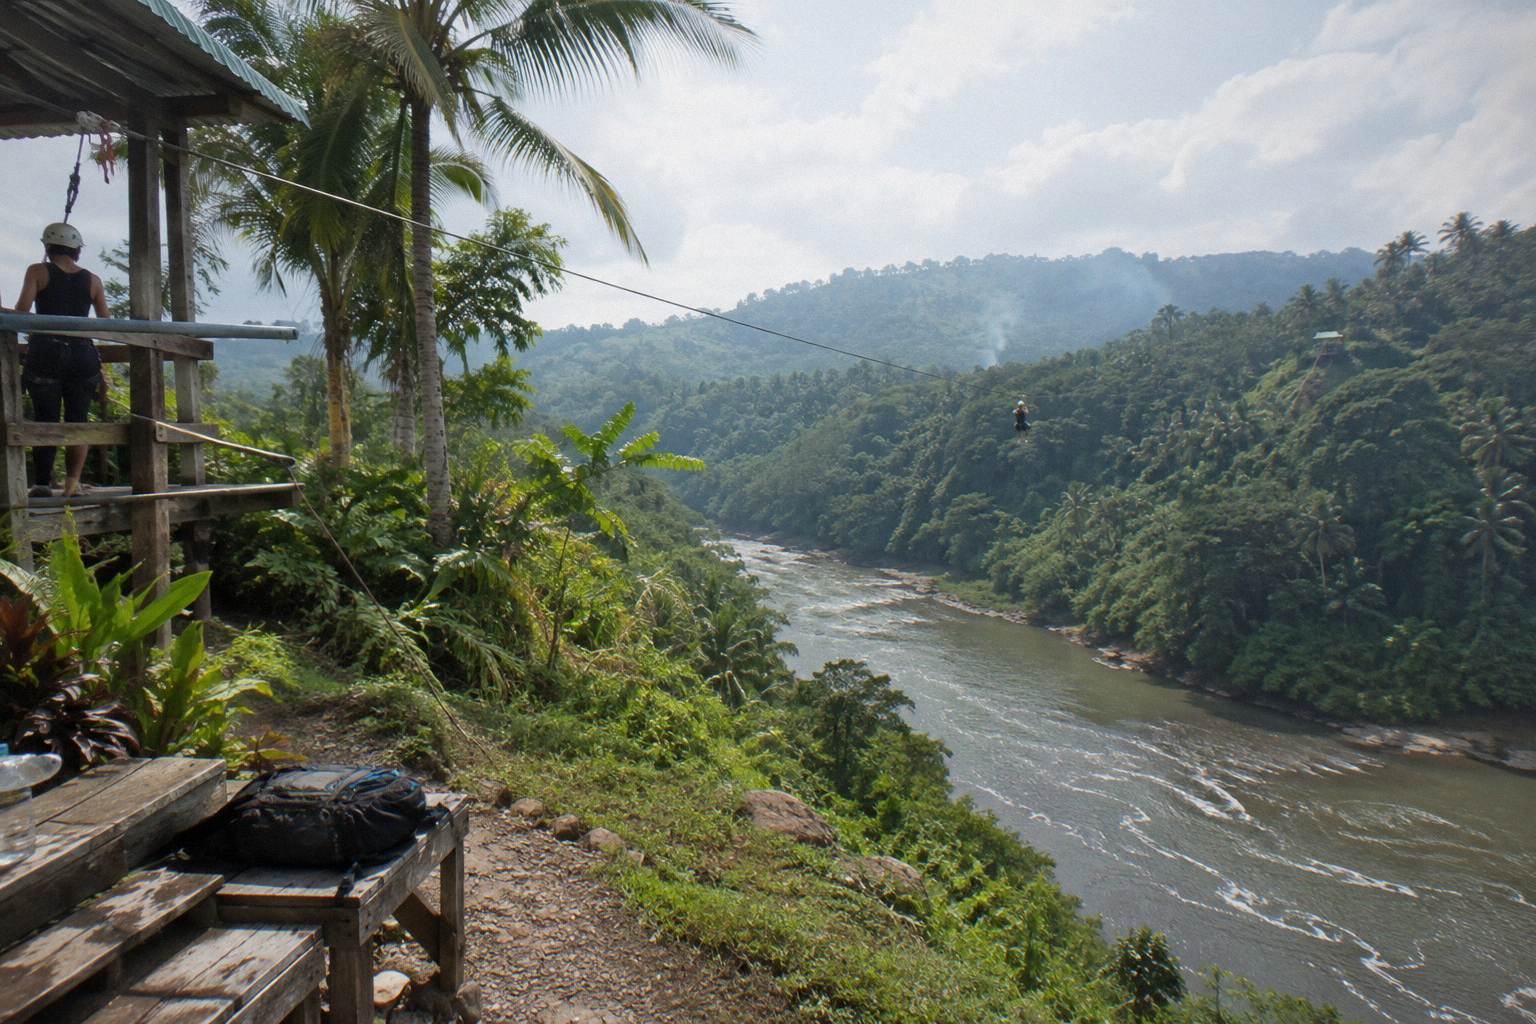
The question people actually want answered before they clip into a harness is simple: how often does this go wrong? The published research does not answer it the way a car-crash statistic would, because nobody counts rides. What the sources do give is emergency-department totals from the United States, a breakdown of which body parts and injury types show up, and a set of written standards that name the safeguards. This piece works through those numbers, all of them US figures labelled by study period, and then covers what the two Fiji operators publish about their own courses. If you are weighing a specific booking, the Momi Bay zipline and cave tour is the largest Momi listing, rated 4.9 from 303 reviews on the booking page.
What Is The Injury Rate For Ziplines?
There is no published injury rate per ride for ziplines, commercial or otherwise, in any of the sources behind the numbers below. The closest figure is a US population rate: 11.64 zipline injuries per million US residents in 2012, up 52.3 percent from 2009, from a study in the American Journal of Emergency Medicine. That is injuries per million people, not per ride, and it counts every kind of zipline, including backyard rigs.
The study, covering US emergency-department treatments from 1997 through 2012, estimated 16,850 zipline injuries across that whole 16-year span. A second study in the Journal of Pediatric Surgery, looking at 2009 to 2015, estimated 9,397 injuries among US children. A third dataset, reported by Lower Extremity Review, runs 2000 to 2024 and puts the total at an estimated 46,572 emergency-department visits, of which 7,962, or 17.1 percent, were lower-extremity injuries.
Those three totals sound alarming side by side, and they should be read carefully. All three draw on US emergency-department records, which capture the injuries serious enough to reach a hospital, and all three include home-made and playground ziplines alongside commercial operations. The pediatric study is explicit about this split: 45.9 percent of its injuries happened on home-made ziplines and 54.1 percent on playground ziplines, and neither of those categories is a commercial tour with guides, platforms and braking systems.
So the rate question dissolves into three smaller questions: what the raw US totals count, which injuries dominate, and what the commercial side of the industry does differently. The first dataset, the American Journal of Emergency Medicine study, is the anchor for most of what follows, and its numbers are US figures for the periods stated. Nothing in the sourced material gives a Fiji injury figure, and nothing here invents one.
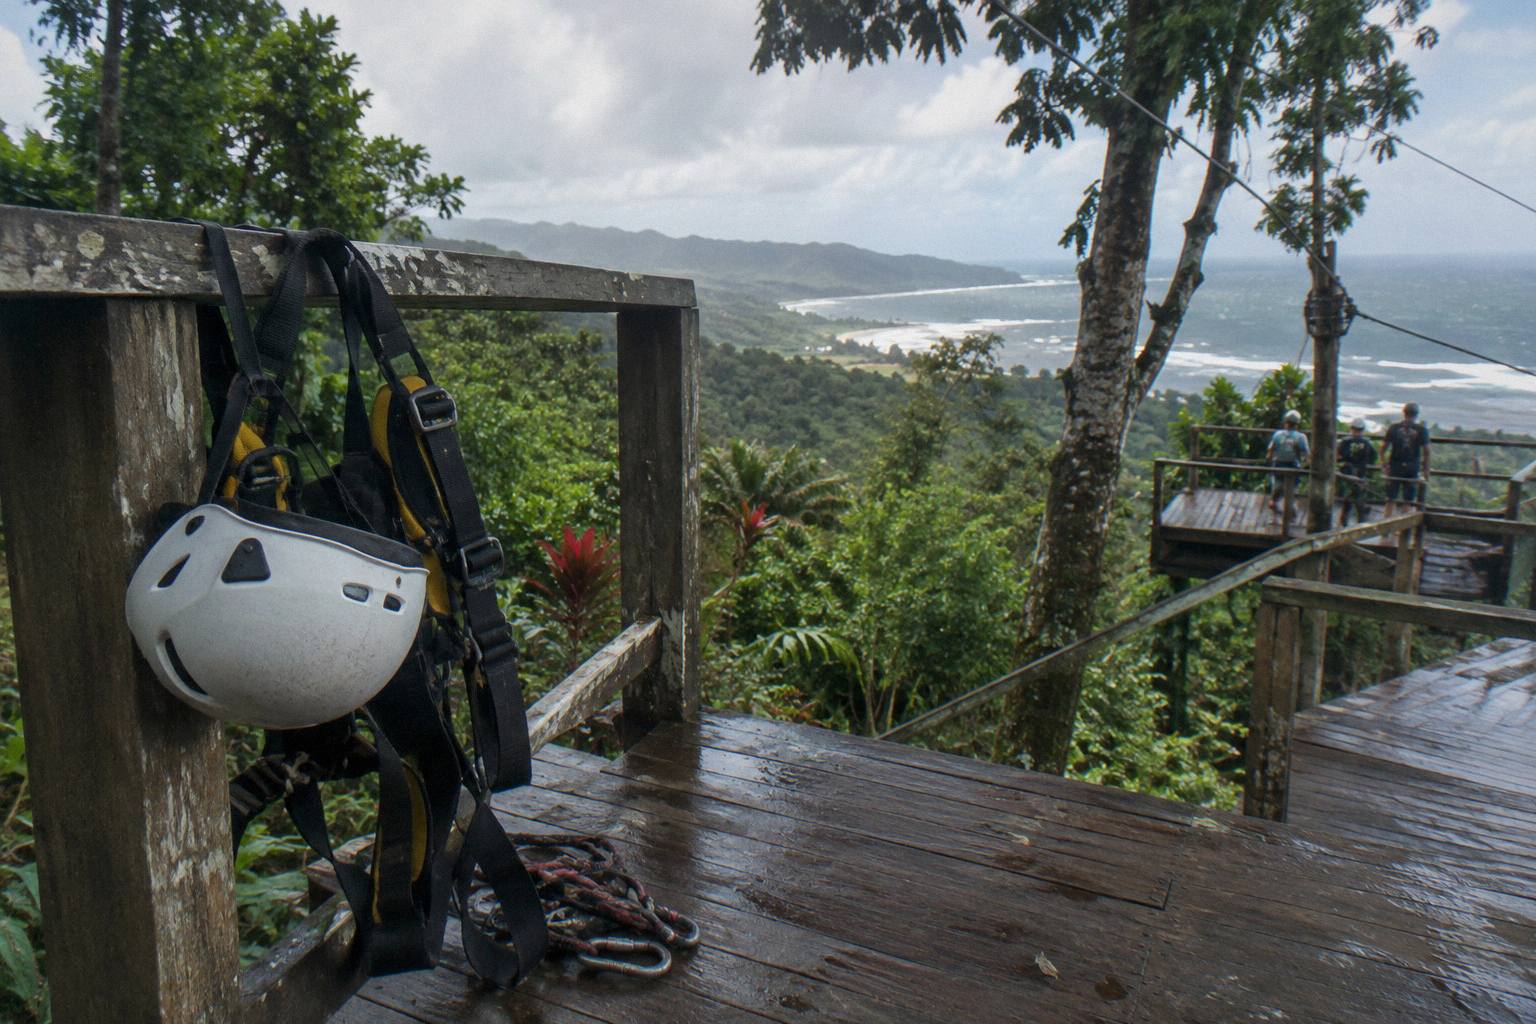
Where The Injury Numbers Come From
Every injury figure in the published sources is a US emergency-department estimate, produced by sampling hospital records and scaling up, not by counting zipline rides. The three datasets cover 1997 to 2012, 2009 to 2015, and 2000 to 2024 respectively, and each states its method and its population. None of them separates commercial canopy tours from backyard cables, which is the single biggest caveat when applying them to a guided tour.
Emergency-department data has a known shape. It captures the injuries that hurt enough or look serious enough to send someone to a hospital, so a bruised hip from a soft landing at a commercial course may never appear, while a fall from a home-made rig almost certainly does. The studies also sample rather than count every visit, which is why their totals carry the word "estimated". That is normal for this kind of research and not a reason to dismiss the numbers, but it is a reason to quote them as estimates.
| Dataset | Period covered | Estimated total | Key detail |
|---|---|---|---|
| American Journal of Emergency Medicine | 1997 to 2012 (US) | 16,850 injuries | 11.64 per million population in 2012 |
| Journal of Pediatric Surgery | 2009 to 2015 (US) | 9,397 injuries, children | 45.9 percent home-made, 54.1 percent playground |
| Lower Extremity Review | 2000 to 2024 (US) | 46,572 injuries | 17.1 percent lower-extremity |
The pediatric study, the Journal of Pediatric Surgery paper, is worth a close look because its findings point away from commercial tours. Ages 5 to 9 were the most affected group, and the injuries clustered on equipment a family builds or finds in a playground, not on a course where a guide clips every carabiner. If you are a parent weighing a Fiji tour, that distinction matters: the child-injury picture is largely a home-rig picture.
None of this makes a commercial tour risk-free, and no sentence here should be read that way. Ziplining carries real risk, the safeguards have failure modes like any mechanical system, and the industry's own literature names operator error, rider error, and equipment or braking failure as the causes behind serious incidents. The numbers simply do not support a per-ride rate, and a page that hands you one is guessing.
What Injuries Are Most Common On Ziplines
Fractures are the most common serious zipline injury in every dataset. In the 1997 to 2012 US study, fractures were 46.7 percent of emergency-department cases and falls were the mechanism in 77.3 percent, with the upper extremities the most injured body region at 44.1 percent. Children aged 0 to 9 made up 45.0 percent of cases, a pattern the pediatric study confirms.
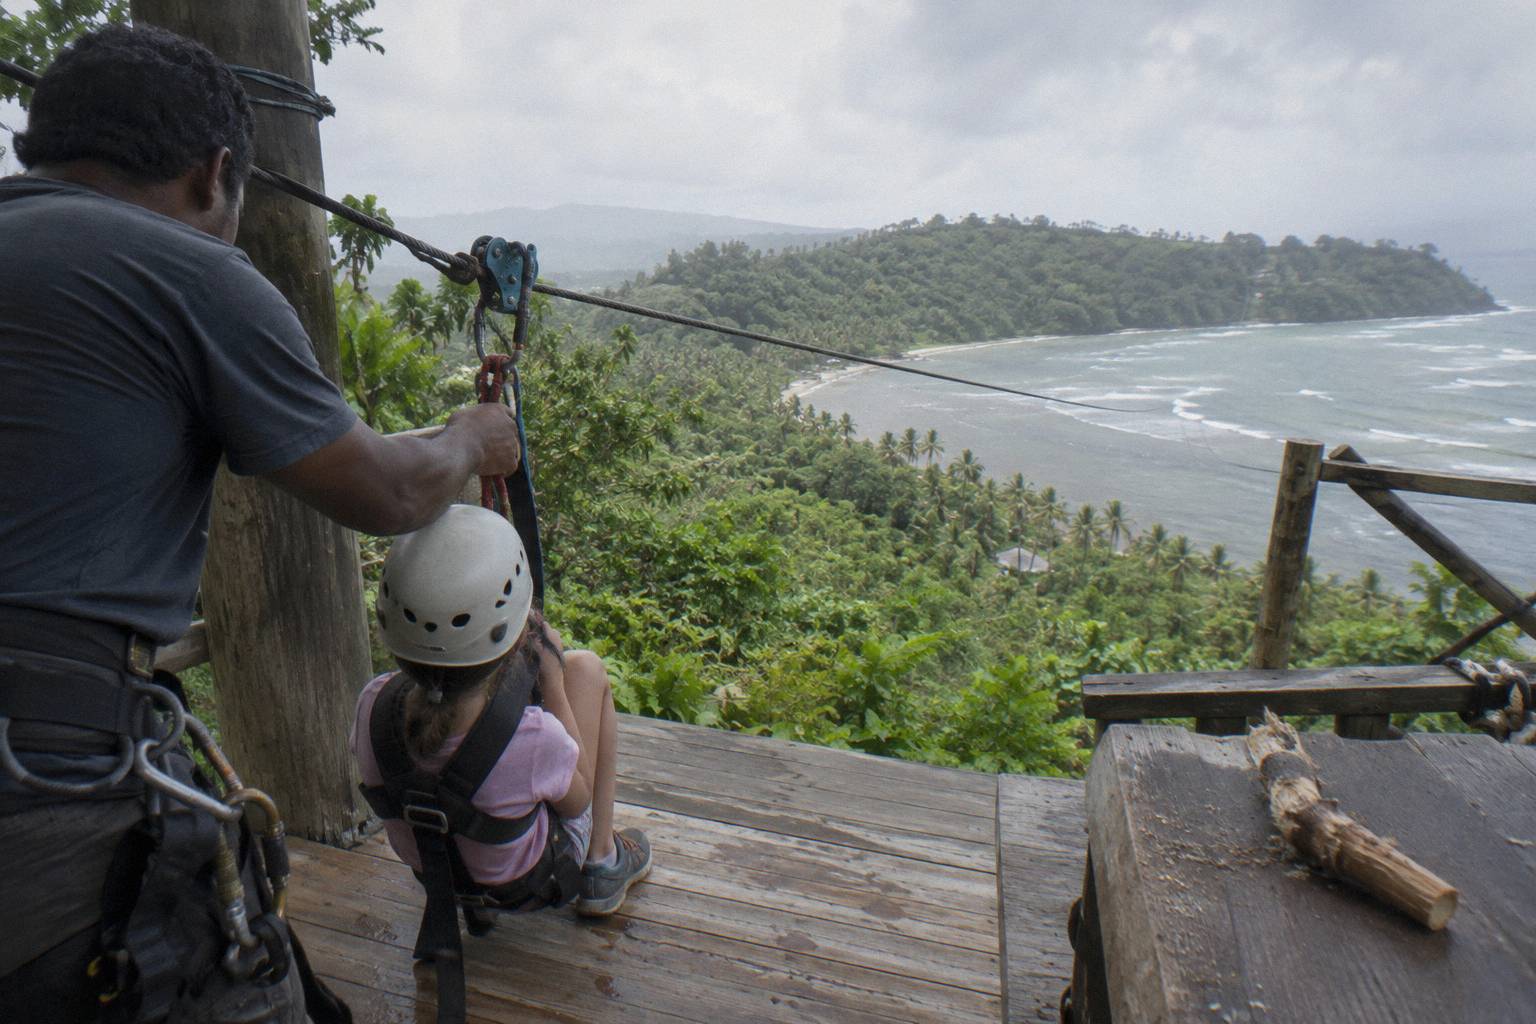
The picture is consistent: a zipline injury, when it reaches a US emergency department, is most often a fall producing a broken bone in an arm, wrist or hand. That tracks with how people instinctively react on a cable, reaching out to catch themselves. The pediatric study puts fractures at 49.8 percent of its cases, essentially the same finding on a different population and period.
| Finding | Figure | Source and period |
|---|---|---|
| Fractures, all cases | 46.7 percent | US emergency data, 1997 to 2012 |
| Upper extremities, most injured region | 44.1 percent | US emergency data, 1997 to 2012 |
| Falls as mechanism | 77.3 percent | US emergency data, 1997 to 2012 |
| Children 0 to 9, share of cases | 45.0 percent | US emergency data, 1997 to 2012 |
| Fractures, pediatric cases | 49.8 percent | US pediatric study, 2009 to 2015 |
| Lower-extremity share | 17.1 percent (7,962 of 46,572) | US emergency data, 2000 to 2024 |
The lower-extremity data, reported by Lower Extremity Review, adds the finer detail. Of the 7,962 lower-extremity injuries in the 2000 to 2024 US data, the most severe diagnosis was a fracture in 31 percent, and the affected body parts split between the lower leg at 33.3 percent and the ankle at 31.9 percent. Landing mechanics, not flight, drive that pattern: arrivals at a platform are where legs take the load.
Read together, the injury-type data tells you where the physical risk concentrates: falls at height and arrivals at speed, hurting wrists, arms and, less often, legs and ankles. It also tells you what the safeguards on a modern course are built against, which is the subject further down. Before that, the home-made question deserves its own section, because it changes what these percentages mean for a paying guest.
Home-made And Playground Ziplines Are Not Commercial Tours
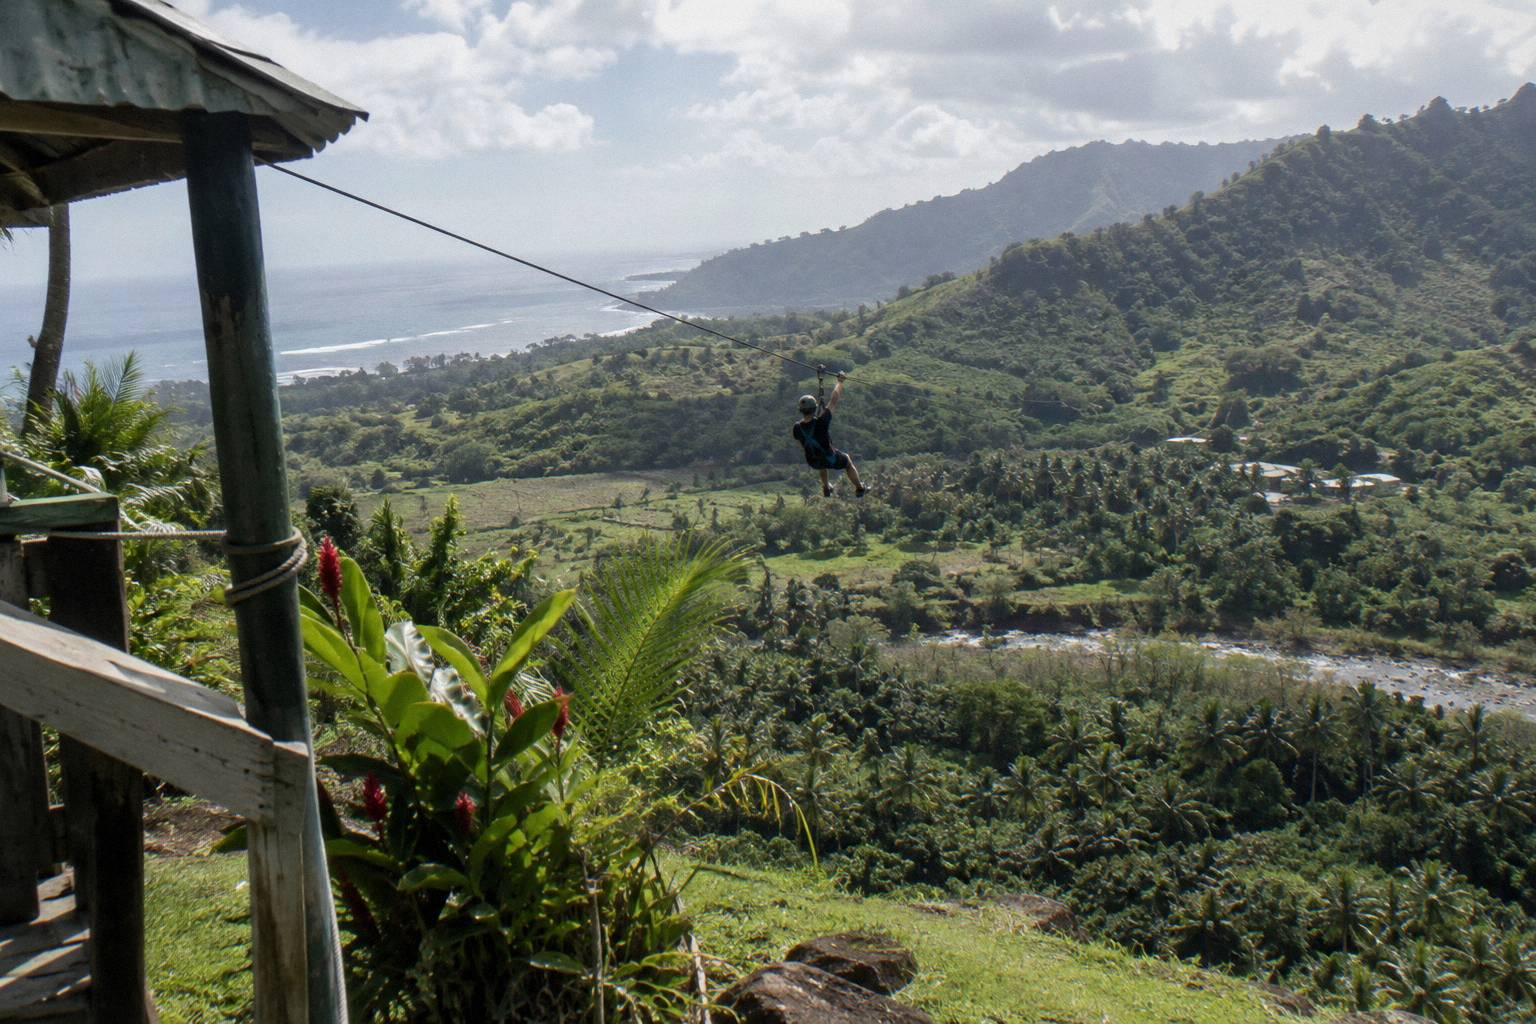
The pediatric study covering 2009 to 2015 found 100 percent of its 9,397 US child injuries occurred on home-made or playground ziplines, split 45.9 to 54.1 percent, with no commercial tours in that dataset at all. Applying those injury figures to a guided canopy tour compares two different machines: an unbraked backyard cable and a course built to written standards with trained staff.
That 100 percent point is the single most useful fact in the whole file for a tour-goer, and it is easy to miss in the headline totals. A home-made zipline typically has no engineered arrival brake, no backup brake, no daily pre-use inspection, and nobody whose job is to check that the rider is clipped correctly. The commercial standards exist precisely because those gaps are where the catastrophic outcomes live.
The obvious objection is selection bias: a commercial course with staff on scene may handle minor injuries without a hospital visit, so its cases never enter the emergency-department data. That is true and worth saying plainly. The data cannot prove commercial tours are safe, only that the counted injuries skew heavily toward unregulated equipment. What the commercial record does offer is benchmarking, covered next, and a written standards regime that names both the hazards and the countermeasures.
So when a headline says thousands of zipline injuries, the accurate reading is: thousands of injuries across everything Americans call a zipline, dominated by rigs nobody inspected. For a Fiji tour decision, the relevant questions shift from raw totals to what standards require and what the operator says it does, and both of those have concrete answers.
What The Industry Benchmarking Shows
Challenge-course industry benchmarking from the Association for Challenge Course Technology, covering 2016 to 2021, recorded about 10,000,000 guests and 225 participant injuries across challenge courses, with zip lines one element of those courses. That works out to a very small injury count per million guests, but it is not a per-ride zipline rate, it covers all challenge-course elements together, and it is not a study in the medical-journal sense.
The benchmarking figure is the closest the sourced material comes to a commercial-sector rate, and it comes with a firm instruction attached: do not turn it into a per-ride rate. The denominator is guests across whole challenge courses, of which a zip line is one part, and the numerator is participant injuries of every severity. It cannot be compared with the emergency-department totals, which use a different denominator, a different severity filter and a different equipment population.
Why does it still matter? Because it is the only dataset in the file drawn from commercial operations rather than hospital records, and it gives an order of magnitude: injuries at commercial challenge courses, in the years sampled, ran at a level of a couple of dozen per million guests across all elements. That is the industry's own reporting, not an audit, and it should be treated as indicative rather than definitive.
For a reader deciding whether to book, the benchmark slots into a simple framework. The medical data says what goes wrong when ziplines are unregulated and riders unsupervised: fractures from falls, mostly. The benchmarking says commercial operations report participant injuries at a much lower order of frequency, with caveats on scope. The standards say what a well-run course is supposed to do about the remaining risk. Each layer answers a different question, and none of them, alone, is "the injury rate".
What The Standards Require Operators To Do
Two written standards govern commercial zip lines: ASTM F2959, the standard practice for aerial adventure courses covering design, manufacture, installation, operation, maintenance, auditing and major modification, and ANSI/ACCT 03-2019, covering design, construction, inspection, operation, maintenance and staff training. ACCT guidance calls for documented pre-use checks before participants ride and annual inspections by qualified persons.
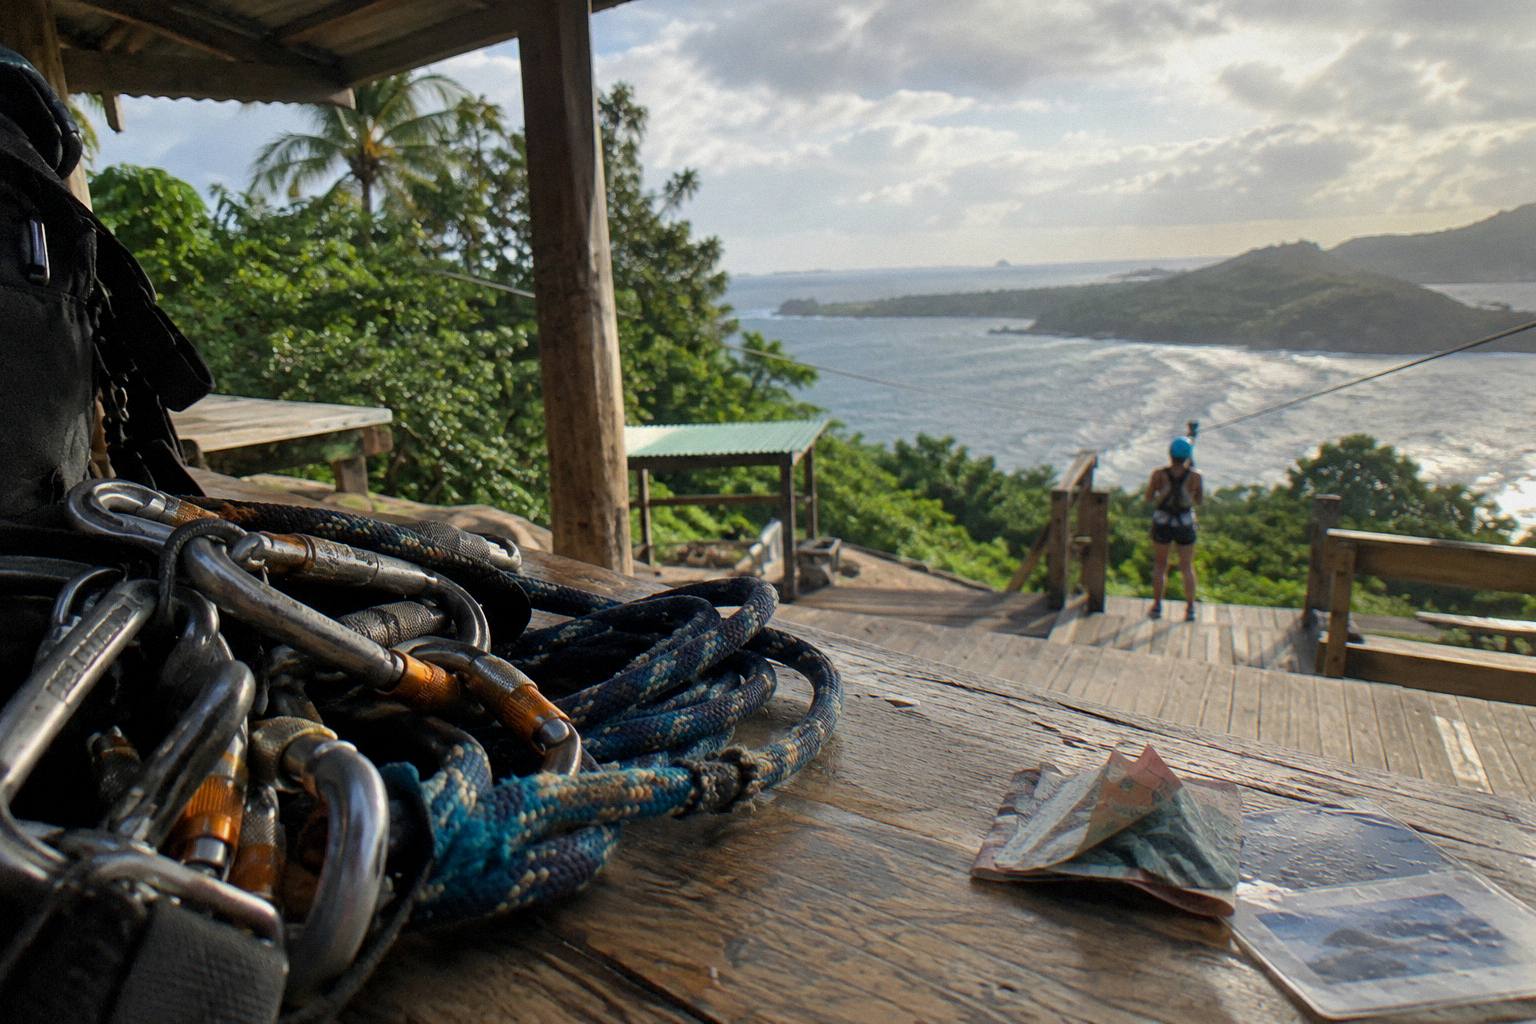
The standards are where the engineering answer to the injury data lives. Faster zip lines are called on to have a primary brake and a backup brake, so that a single braking failure does not send a rider into the arrival platform at speed. An emergency arrest device is the general requirement when failure of the primary brake could let landing speeds exceed about 10 km/h. These are design rules written against exactly the arrival scenarios that fill the injury tables.
| Requirement or practice | What it addresses |
|---|---|
| Primary plus backup brake on faster lines | Arrival-speed injuries, braking failure |
| Documented pre-use checks before participants ride | Equipment faults caught before guests arrive |
| Annual inspection by a qualified person | Slow degradation, structural issues |
| Trained staff, evacuation or rescue plan | Riders stopping short mid-line, abnormal conditions |
| Guide-clipped carabiners, double lanyards | Operator error and rider error, the named causes |
The standards also address the human causes the literature names directly. Serious incidents are attributed to operator error such as failure to belay or clip, rider error, and equipment or braking failure, and the named safeguards are guide-clipped carabiners, double lanyards, redundant brakes and pre-ride checks. When a rider stops short mid-line, which happens when a light rider loses momentum, guides at the platform use a pull-in rope or a mechanical-advantage rescue system rather than leaving the guest to improvise.
The full text behind much of this is the ASTM F2959 standard page, and the challenge-course inspection guidance sits with the ACCT standards body. Neither document is bedtime reading, but their existence is itself information: commercial ziplining is an engineered activity with published criteria, which is a categorically different starting point from the home-made cables that dominate the injury data.
What The Fiji Operators Say They Do
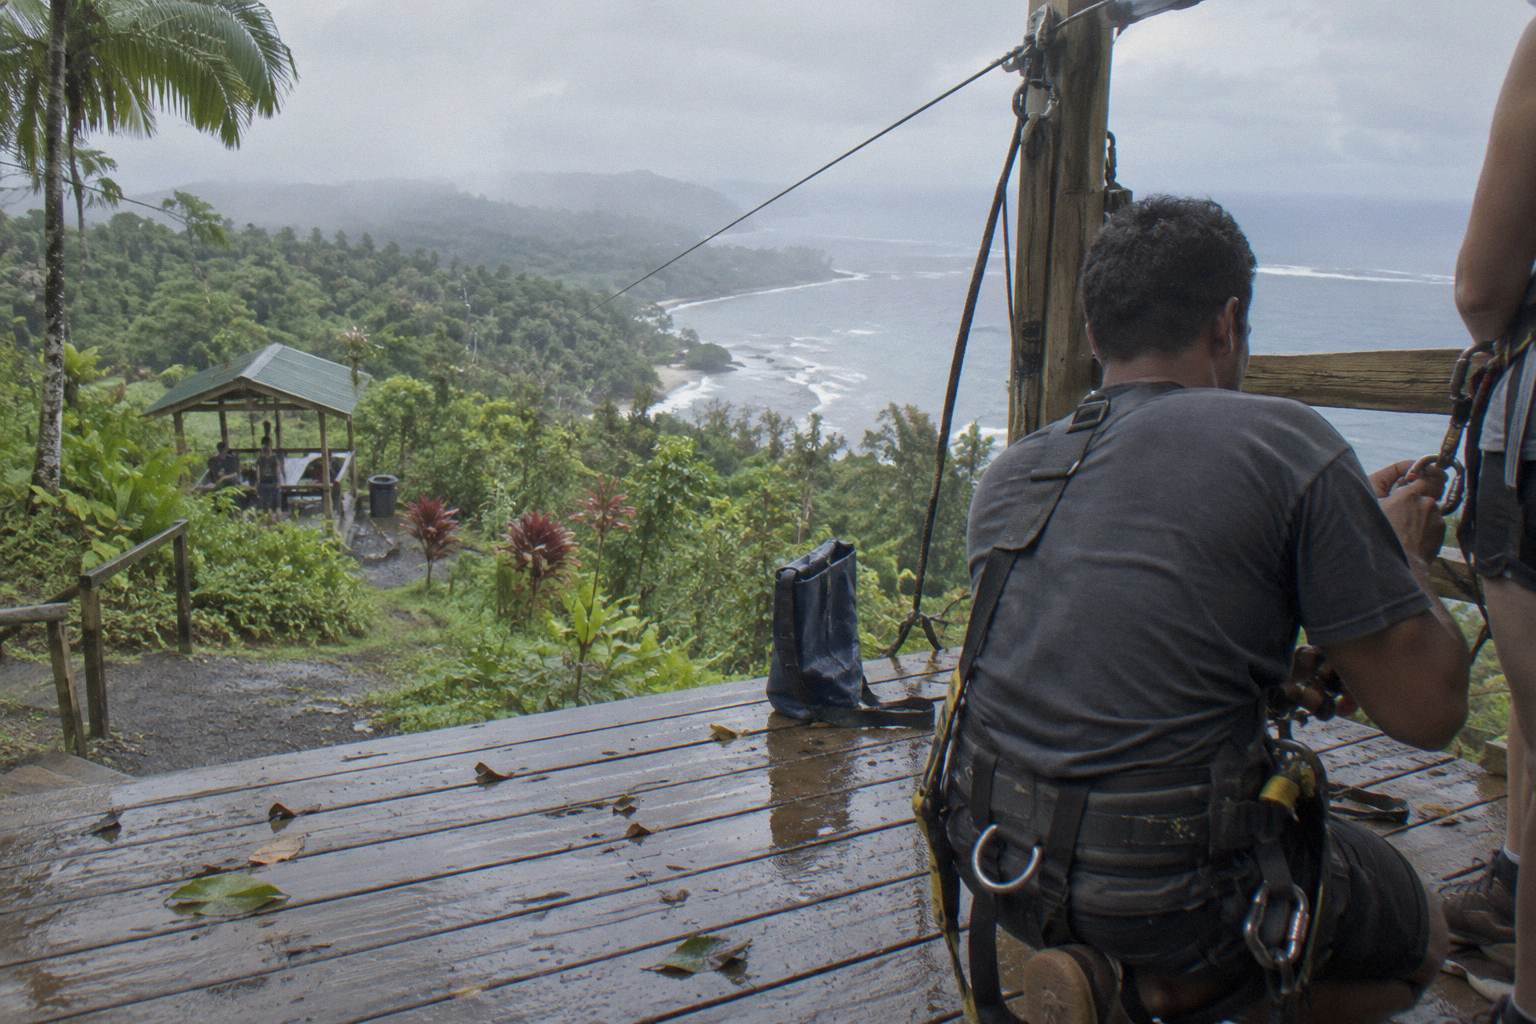
Zip Fiji and Sleeping Giant Zip Line each publish safety and eligibility information for their own courses. Zip Fiji runs groups of up to 16 guests with 5 guides, holds a safety briefing and equipment fitting before the tour, and operates in all weather except lightning overhead, high winds and especially heavy rain. No sourced material states certification, inspection or licensing status for either operator.
The Zip Fiji course at Momi Bay runs 16 lines and 27 platform stations with a guided tour of the caves, and the operator's own FAQ sets the participation bar: riders must be able to walk 15 minutes uphill over uneven ground unassisted, have full range of motion in arms, shoulders, neck and back, and stand on a platform about 5 stories high without severe anxiety or dizziness. Those fitness rules are not fine print, they are the operator's own eligibility screen, and they exist because launch, flight and landing all place physical demands on a rider.
The equipment and conduct rules are equally specific on Zip Fiji's side. Cameras are allowed only on a strap, a GoPro only on a helmet strap, and no water bottles, backpacks or belt packs go on the course, because loose items and falls are the injury mechanism the US data keeps flagging. Own climbing gear is not allowed, and intoxicated people may not take part. After the first zip, guests who cannot continue are walked back to the Welcome Centre, which is a planned opt-out rather than an improvised one.
Sleeping Giant Zip Line, the 7-line park at Sabeto with lines of 80 to 160 m and speeds the operator caps at "up to 40 km/h", publishes its own fitness requirements: a 10 to 15 minute uphill walk over uneven ground, about 20 trail stairs, and comfort at heights over 100 ft. Its booking page lists pregnant women, altitude sickness and recent surgeries among the not-suitable groups. The two operators' rules are separate rulebooks for separate courses, and a figure from one never describes the other, as the guide to Zip Fiji versus Sleeping Giant lays out side by side.
If the safety question is your gate before paying, the practical move is reading the operator's own eligibility page against your own body, then checking the specific booking page for the tour variant, because booking pages for the same course can carry different thresholds. The full Momi Bay zipline guide walks through what the tour actually includes, and you can check availability once the rules side checks out. Every booking-page listing for these tours carries free cancellation up to 24 hours before the start, so the decision is reversible.
How The Numbers Should Change Your Decision
The US data argues for three checks before you pay: confirm you meet the operator's stated fitness and eligibility rules, because fractures from falls dominate the injury picture and the eligibility screen is the operator's main defence; secure or remove loose items as the operator instructs; and take the age rules seriously, since children aged 0 to 9 made up 45.0 percent of US cases and ages 5 to 9 were most affected in the pediatric study.
Start with the eligibility screen because it is the one control you apply to yourself. Zip Fiji's FAQ asks whether you can walk 15 minutes uphill unassisted and stand calmly on a high platform; Sleeping Giant asks for a 10 to 15 minute uphill walk, about 20 trail stairs and comfort above 100 ft. Both operators also list medical exclusions, and every operator page and booking page consulted lists pregnancy as not suitable. If any listed condition applies to you, the question is for the operator or a doctor, not for the ride.
Then handle the mechanics of the injury data. Falls at 77.3 percent of cases and upper-extremity fractures at the top of the type table both point at the same behaviour: doing something unplanned with your hands and body at height or on arrival. The operator rules are written against that, with cameras only on straps and no bags on the course, and following them is the cheapest risk reduction available. The abseil combo adds a 40 m descent into the Tau Caves, and its booking page lists claustrophobia and fear of heights among the not-suitable groups for that product, a screen worth heeding before choosing the longer day.
Finally, weigh the weather rule. Zip Fiji runs in all weather except lightning overhead, high winds and especially heavy rain, and the operator, not the guest, makes that call. That is the standards logic in miniature: the conditions that break brakes and platforms are the conditions the operator cancels in. Nadi's wet season runs long, with July and August the short dry window, so if a smooth-weather day matters to you, the guide to ziplining in Fiji's rainy season covers what you need to know.
What Trips People Up Before You Book
Three mistakes recur. First, people quote the emergency-department totals as commercial-tour rates, ignoring that the pediatric dataset's injuries sat entirely on home-made and playground ziplines. Second, people skip the operator's fitness rules and discover the 15 minute uphill walk or the 20 trail stairs on the day. Third, people assume a booking page's thresholds match the operator's stated requirements, when the two can differ, so age and weight should be confirmed with the operator before paying.
The rate-misreading is the most common and the most forgivable, because headlines compress the studies into one number. The defence is remembering what the denominators are: emergency-department visits per population or per period, not injuries per ride. Put plainly, no per-ride rate exists in the published sources, the US totals lean heavily on unregulated equipment, and the commercial sector's own benchmarking, with all its caveats, sits far below the hospital-data picture.
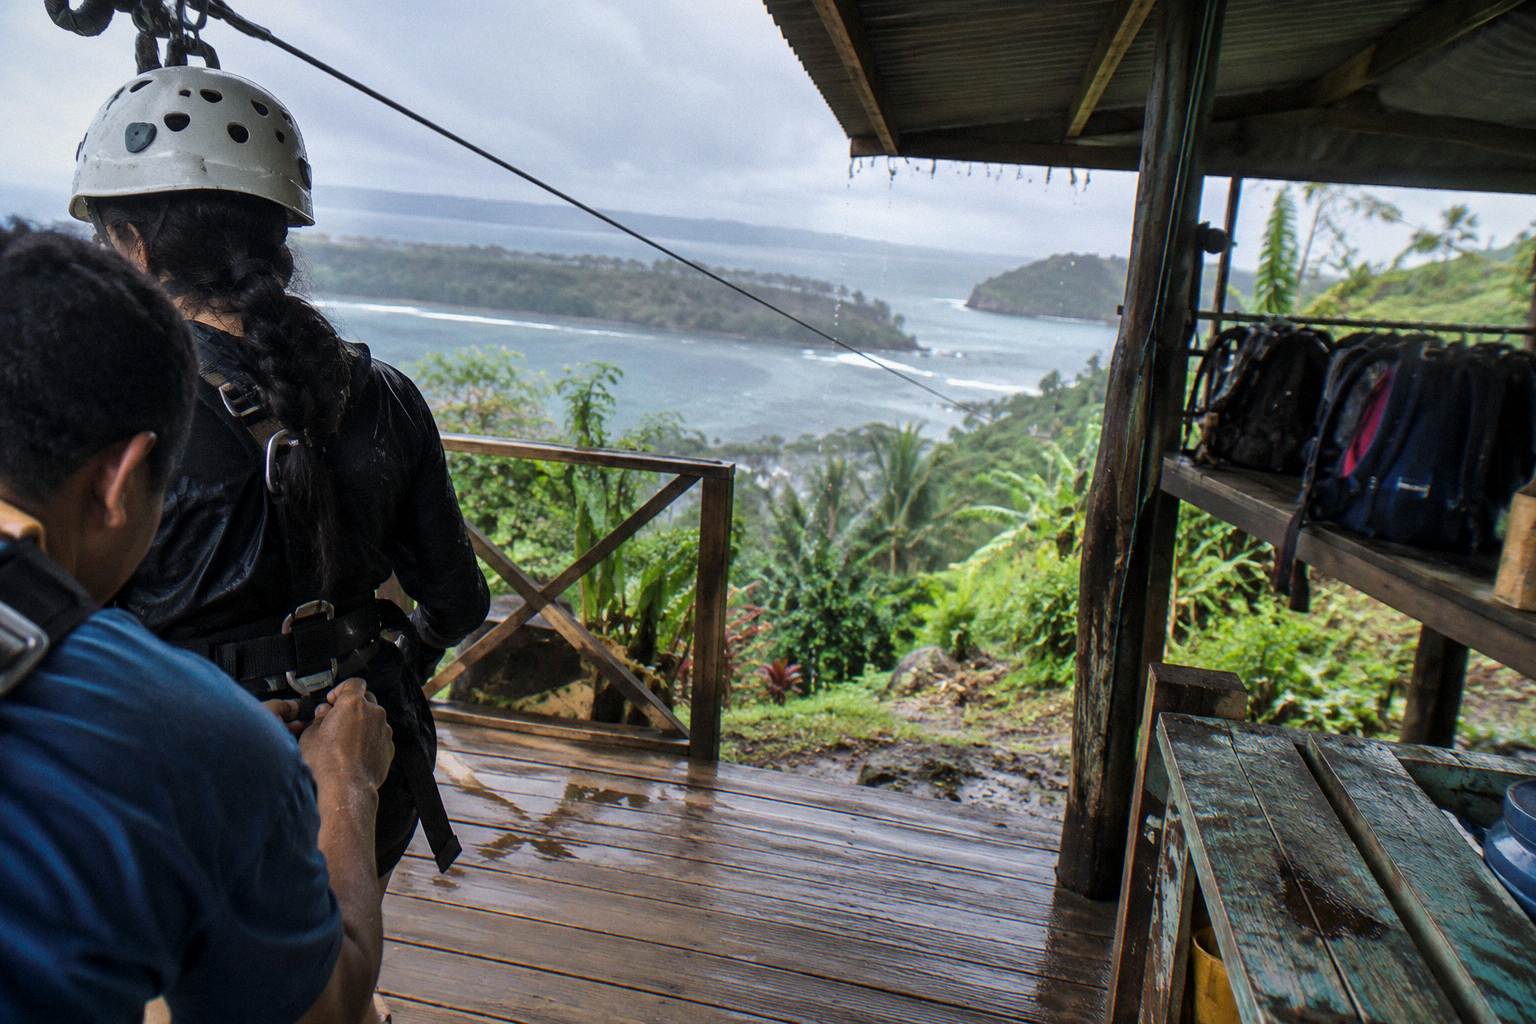
The fitness-rules mistake costs a day rather than a bone. Both operators describe their approaches as uphill walks over uneven ground, and Zip Fiji's is 15 minutes with a platform-height comfort requirement on top. Neither is elite-athlete territory, but both are real screens, and the operator's Head Guide determines whether a rider fits the equipment. Reading those rules before booking, not at the Welcome Centre, is the difference between a tour and a refund conversation.
The thresholds mistake is the quiet one. Zip Fiji's own FAQ gives its figures, age from 3 and under 135 kg with equipment fit determined by the Head Guide, and booking pages for the same course can carry different thresholds, so the operator is the authority to confirm with. At Sleeping Giant, the park's own FAQ and the booking page list different thresholds, so age and weight there are also a confirm-before-paying item. Five minutes of checking closes the gap.
The books on Ziplines In Fiji between these operators open with the same 16-line Momi course and the same 7-line Sabeto park, so the injury-rate question lands on both the same way: no Fiji figure exists in the sources, the US numbers describe a different equipment world, and your own screening against the operator's rules is the step that actually moves your risk.
Common Questions About Injury Rates And Booking
What Is The Injury Rate For Ziplines?
There is no published injury rate per ride. The sourced US figures are emergency-department estimates: 16,850 injuries across 1997 to 2012, 9,397 child injuries across 2009 to 2015, and 46,572 across 2000 to 2024. A population rate of 11.64 injuries per million US residents was recorded for 2012. Those totals include home-made and playground ziplines, which are not commercial tours, and the child dataset's injuries sat entirely on such equipment.
What Is The Most Common Zipline Injury?
Fractures, in every dataset. They were 46.7 percent of US emergency-department cases in the 1997 to 2012 study and 49.8 percent in the 2009 to 2015 pediatric study. The upper extremities were the most injured body region at 44.1 percent, and falls were the mechanism in 77.3 percent of cases. In the lower-extremity subset, the lower leg and the ankle each accounted for roughly a third of affected body parts.
Are Commercial Zipline Tours Safer Than Backyard Ziplines?
The published data cannot prove it as a rate, but the pediatric study found 100 percent of its counted US child injuries on home-made or playground ziplines, none on commercial courses, and the commercial challenge-course benchmark for 2016 to 2021 recorded 225 participant injuries across about 10,000,000 guests over all course elements. Commercial courses also operate under written standards with brakes, inspections and trained staff that home rigs lack.
Is There A Fiji Zipline Injury Figure?
No Fiji injury or fatality figure appears in the sourced material, and none is given here. What exists for Fiji is what the operators publish themselves: Zip Fiji's FAQ eligibility rules and weather policy, and Sleeping Giant's fitness requirements and not-suitable list. Decisions rest on those operator statements plus the US research, read with the caveats above.
Do Children Get Hurt More Often On Ziplines?
The US emergency-department data skews young: children aged 0 to 9 made up 45.0 percent of cases in the 1997 to 2012 study, and ages 5 to 9 were the most affected group in the pediatric study. Both datasets count home-made and playground equipment alongside commercial courses. On the Fiji courses, Zip Fiji's FAQ sets its own rules, from age 3 with children under 18 accompanied by an adult, and Sleeping Giant's thresholds should be confirmed with the park directly.
What Makes A Zipline Tour Run Or Cancel?
For the Momi course, Zip Fiji states the tour runs in all weather except lightning overhead, high winds and especially heavy rain, and the operator makes that call. Sleeping Giant publishes no weather rule, so ask the park. Standards also call for documented pre-use checks before participants ride, and guides are trained on an evacuation or rescue plan for abnormal conditions, including a pull-in rope or mechanical-advantage system when a rider stops short mid-line.